
Are your Power BI dashboards doing their job? Are they engaging, intuitive, and truly empowering your end-users to find the insights they need quickly and effortlessly? If you’re looking to transform your dashboards from static reports into dynamic, interactive experiences, then it’s time to unlock the power of Power BI bookmarks.
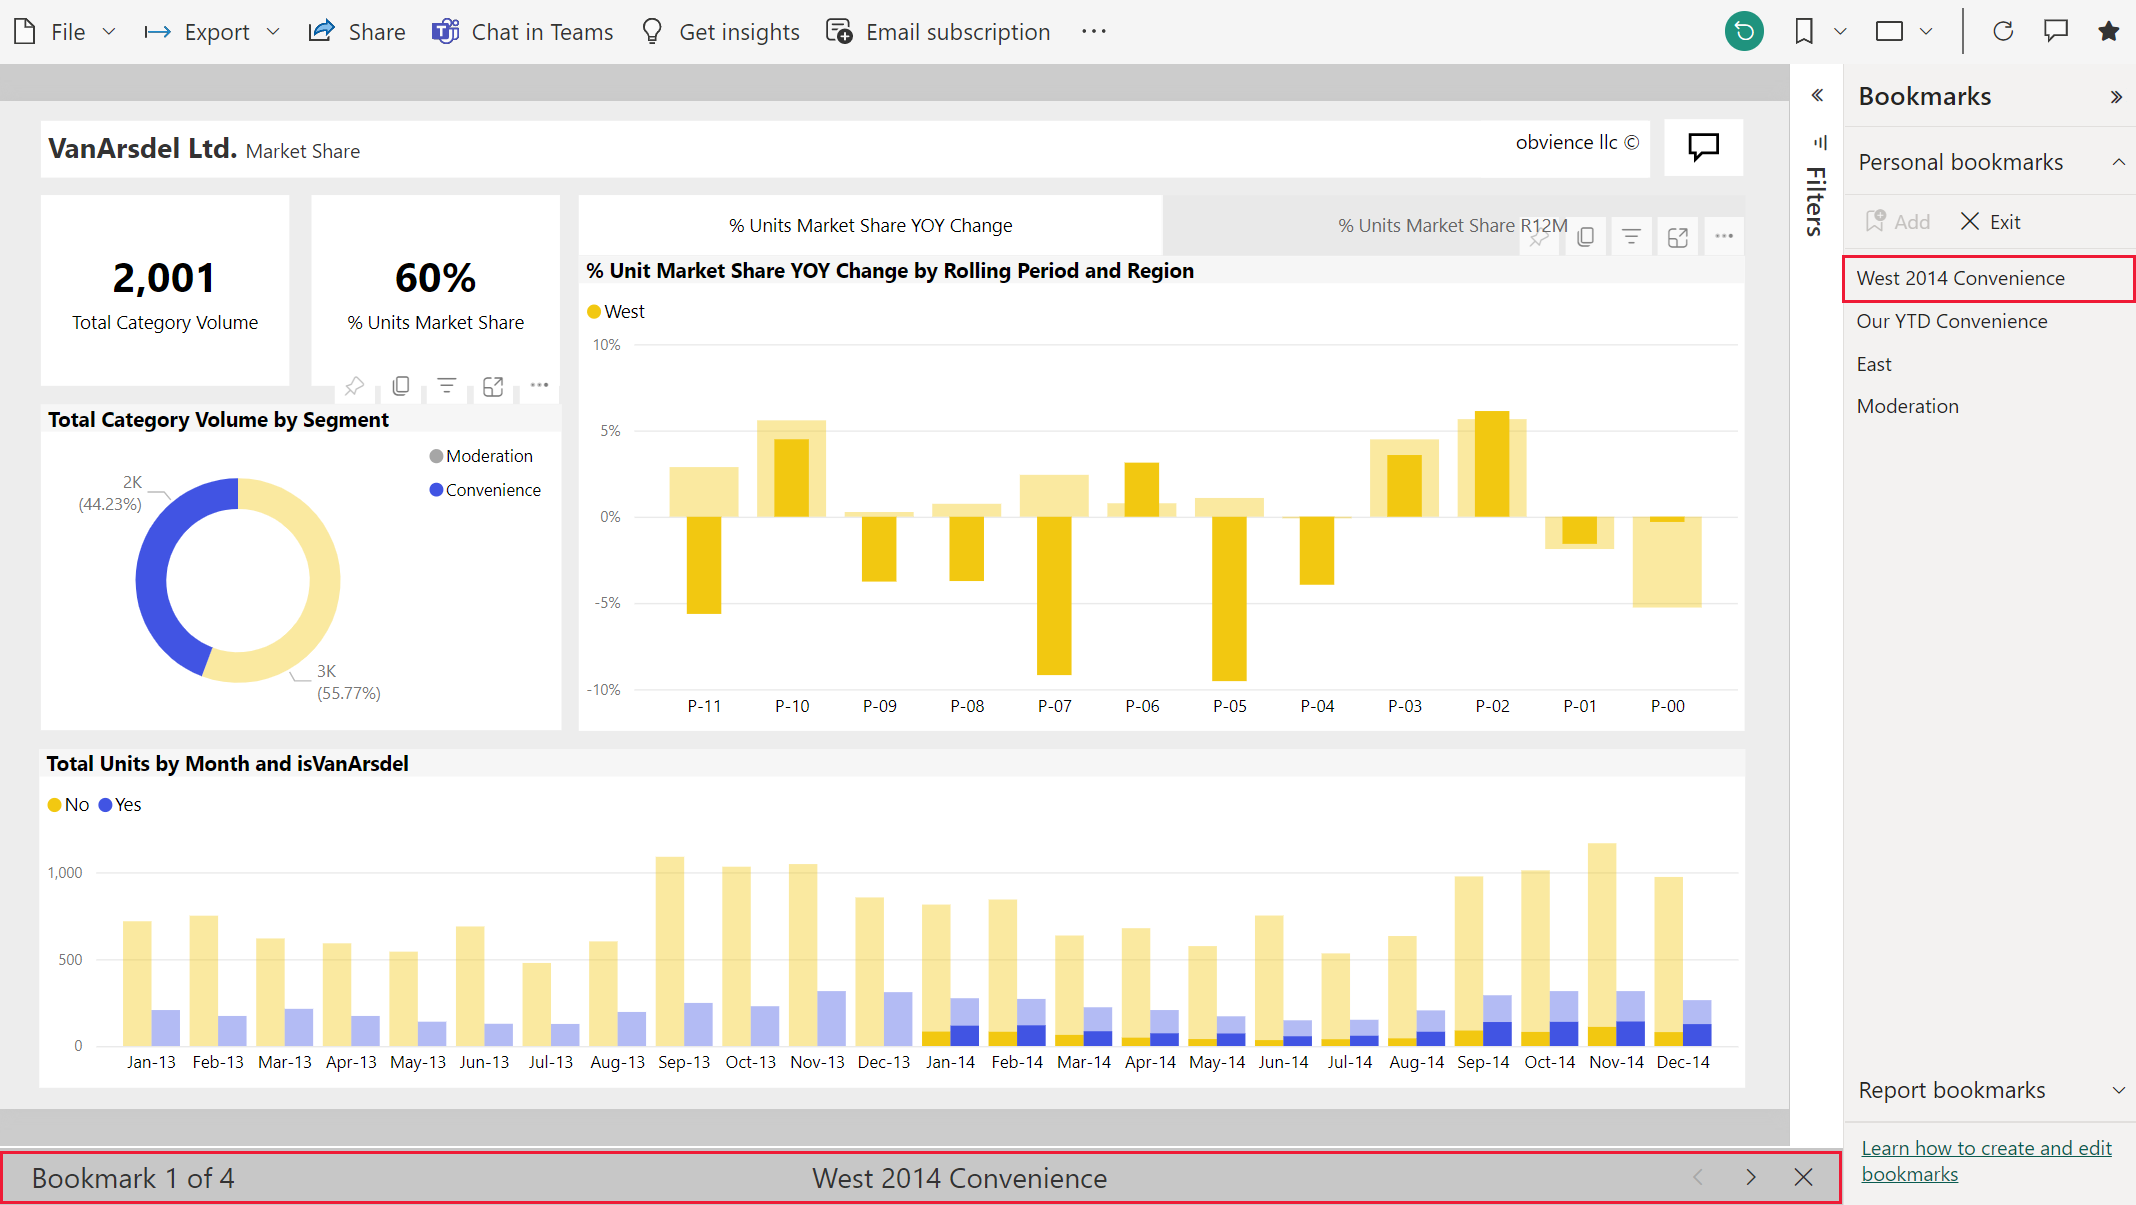
Often overlooked, bookmarks are a game-changer for User Interface (UI) and User Experience (UX) in Power BI. They allow you to capture the current state of a report page – including filters, slicers, sort order, drill-down locations, and even the visibility of visuals – and then navigate back to that exact view with a single click. Think of them as predefined “snapshots” that guide your users through a curated analytical journey.
Why Bookmarks are a UI/UX Game-Changer
Imagine a dashboard with multiple layers of detail, various analytical paths, or different comparison views. Without bookmarks, your users might spend valuable time fiddling with filters and slicers, trying to recreate specific scenarios. This leads to frustration, lost time, and potentially missed insights.
Here’s how bookmarks drastically improve the UI/UX for your end customers:
- Guided Storytelling: Lead your users through a narrative. Start with an executive summary, then use bookmarks to drill down into specific departments, regions, or product lines, highlighting key trends along the way.
- Simplified Navigation: Instead of overwhelming users with too many filters on a single page, create dedicated “views” accessible via buttons linked to bookmarks. This declutters your interface and makes navigation intuitive.
- “What If” Scenarios: Easily toggle between different scenarios (e.g., “current performance” vs. “budget forecast”) by saving each scenario as a bookmark.
- Personalized Experiences: While not truly personalized in the user-specific sense, you can offer different “lenses” on the data (e.g., a bookmark for “Sales Team View” and another for “Marketing Team View”) from a single report.
- Focus and Clarity: Use bookmarks to dynamically show or hide visuals, drawing attention to specific data points or charts relevant to a particular analysis. This eliminates visual clutter when not needed.
Easy Steps to Implement Bookmarks for Better UI/UX
Let’s walk through a simple example of how to use bookmarks to improve your dashboard’s flow.
Scenario: You have a sales dashboard, and you want to show views for “Overall Sales Performance” and “Regional Sales Deep Dive” without creating separate pages.
Steps:
-
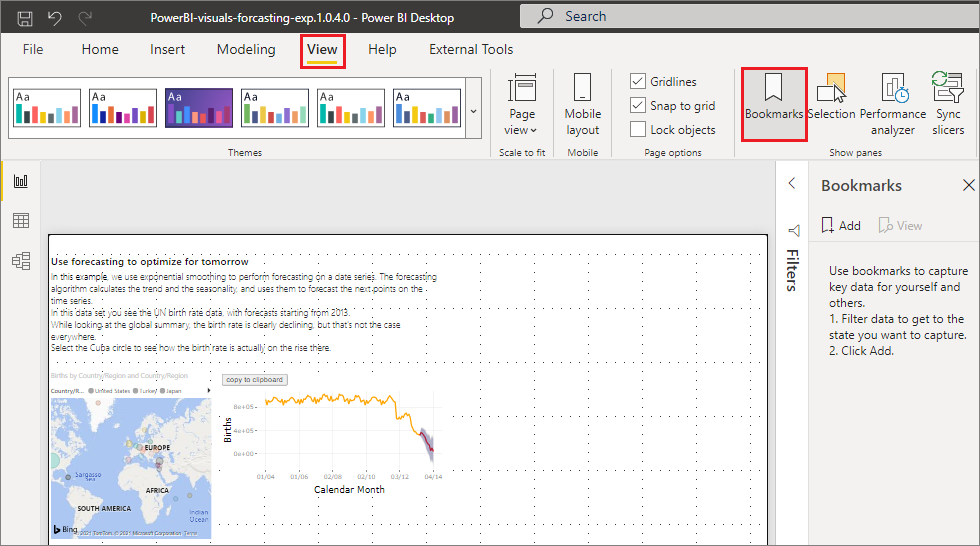
Open the Bookmarks Pane and Selection Pane:
-
In Power BI Desktop, go to the View tab.
-
Check “Bookmarks” and “Selection” to open their respective panes. The Selection pane is crucial for showing/hiding visuals.
-
-
Set Up Your First View (e.g., “Overall Sales Performance”):
-
Arrange your visuals as you’d like them for this view.
-
Adjust any filters or slicers.
-
In the Bookmarks pane, click “Add”.
-
Rename the new bookmark to “Overall Sales Performance”.

-
-
Set Up Your Second View (e.g., “Regional Sales Deep Dive”):
-
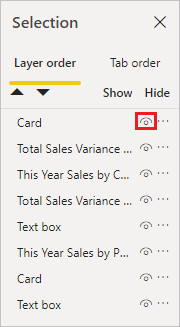
This is where the Selection Pane comes in handy.
-
Hide any visuals from “Overall Sales Performance” that you don’t want in this view (e.g., a global summary card). To do this, click the eye icon next to the visual name in the Selection pane.
-
Show any visuals relevant to “Regional Sales Deep Dive” (e.g., a map visual, a regional slicer).
-
Apply relevant filters (e.g., select a specific region in your slicer if you want the bookmark to start with that selection, though you can also leave it open for user interaction).
-
In the Bookmarks pane, click “Add”.
-
Rename this bookmark to “Regional Sales Deep Dive”.
-
-
Create Navigation Buttons:
-
Go to the Insert tab.
-
Click “Buttons” and choose a blank button or an arrow.
-
Place the button on your report page.
-
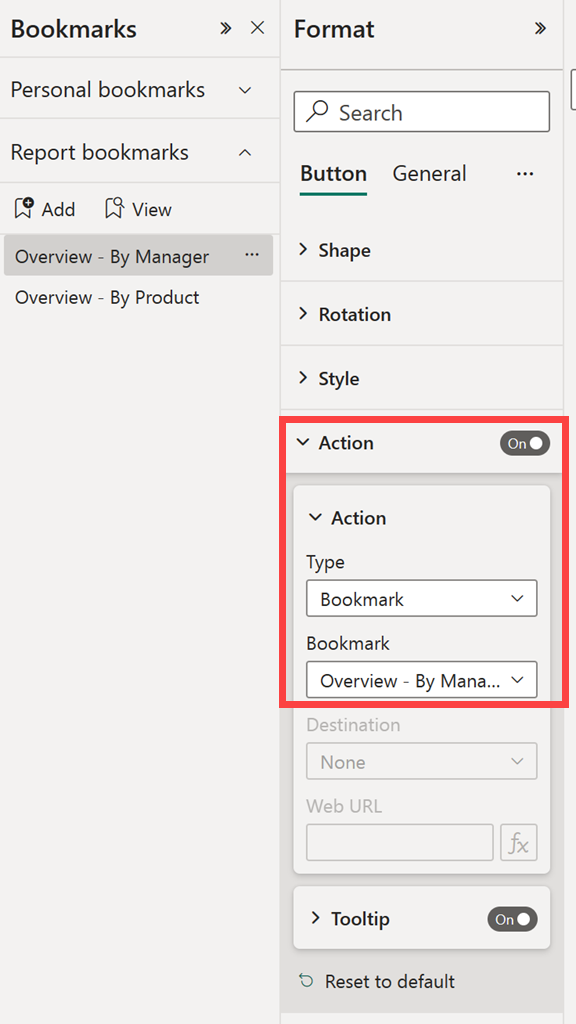
With the button selected, go to the Format pane (Visuals tab).
-
Expand “Action” and turn it On.
-
For Type, select “Bookmark”.
-
For Bookmark, choose “Overall Sales Performance” for your first button.
-
Add text to the button (e.g., “View Overall Sales”).
-
Repeat this process for the “Regional Sales Deep Dive” bookmark.
-
-
Test Your Bookmarks:
- In Power BI Desktop, hold Ctrl and click on your buttons to test the navigation.
- Observe how the visuals change and how the filters/slicers update.
Best Practices for Bookmark-Driven UI/UX
- Plan Your User Journey: Before building, map out how you want users to interact with your dashboard.
- Clear Button Labeling: Use intuitive and descriptive text on your bookmark buttons.
- Consistent Placement: Place navigation buttons in a consistent location on your report page for easy access.
- Use Reset Bookmarks: Consider adding a “Reset All Filters” bookmark to allow users to return to a default state.
- Combine with Drill Through: Bookmarks can work beautifully with drill-through functionality for even deeper analysis.
- Keep it Simple: Don’t overcomplicate your bookmarks. Focus on addressing specific UI/UX pain points.
By strategically implementing bookmarks, you’re not just creating reports; you’re crafting engaging, intuitive, and highly effective analytical experiences for your end-users. Start experimenting today and witness the transformation in your Power BI dashboards!