🎧 Listen to the Download
This is an AI generated audio.
Welcome to DevGyan Download ! In this issue, we delve into how open-source technology is transforming cloud databases, how user-friendly visual tools enhance business insights, and why technical debt should be a top priority for every organization. Stay tuned for practical takeaways that empower you to make informed decisions in 2025 and beyond.
Synoposis is my LinkedIn newsletter where I write about the latest trends and happenings in the data world. Download is where I deep dive further about content covered in synopsis. You can also listen to the audio version of Download. Also, you are at the right place if you want to stay updated with the latest trends in data, AI, and cloud technologies.
Checkout previous editions of DevGyan:
FerretDB Cloud: Open Source Alternative to MongoDB Atlas?
FerretDB has launched FerretDB Cloud, a managed service that mimics MongoDB but runs on open‑source PostgreSQL. The new offering targets developers who want a cross‑cloud, MongoDB‑compatible database without the vendor lock‑in of MongoDB Atlas. Currently live on AWS (including the AWS Marketplace), the service is powered by DocumentDB—an open‑source project now part of the Linux Foundation.
Key Highlights
- FerretDB is built on PostgreSQL and delivers the most common MongoDB features, including vector search, while staying fully open‑source under Apache 2.0.
- Managed tiers provide up to 64 TB of storage, full encryption, and a 99.99 % SLA on the enterprise plan.
- Future plans include multi‑cloud support for Azure and Google Cloud, expanding beyond the AWS‑only launch.
- Unlike other alternatives such as Azure Cosmos DB for MongoDB or Amazon DocumentDB, FerretDB Cloud claims to deliver the exact feature set of a local FerretDB instance, positioning itself as a true open‑source competitor to Atlas.
The team, led by co‑founders Peter Farkas and Alexey Palazhchenko, stresses that FerretDB offers developers a “free‑to‑use” MongoDB experience without the restrictive licensing of MongoDB’s SSPL.
My Take
From a data‑engineering perspective, FerretDB Cloud is an exciting, pragmatic solution for teams that need MongoDB compatibility but crave the stability and transparency of PostgreSQL. The open‑source foundation removes the licensing cliff that plagues many managed MongoDB services, and the promise of full-feature parity—including vector search—makes the migration path less frictional. While the service is still early in its multi‑cloud journey, its current AWS availability and clear pricing tiers make it a compelling alternative for developers, students, and small‑project owners looking to avoid vendor lock‑in without sacrificing functionality.
KPI Card Visual in Power BI – A Quick, Clean Comparison Tool
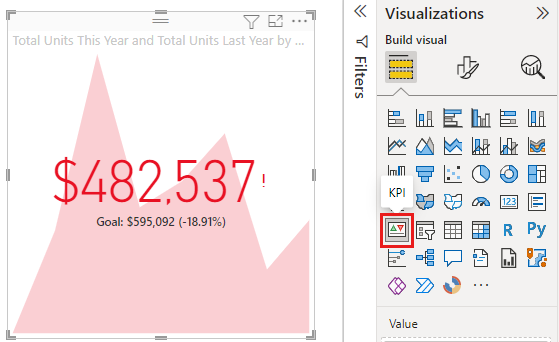
The KPI card visual in Power BI is a compact way to juxtapose an actual metric against a target or prior period. It displays:
- Indicator Value – the primary metric (e.g., sales this year).
- Target/Comparison Value – a benchmark (e.g., last year’s sales).
- Trend Axis (Optional) – a background trend that can be turned off for a static comparison.
Use cases span year‑over‑year analysis, period‑over‑period performance, goal tracking, and balanced scorecard dashboards. Typical scenarios include comparing current month revenue to the same month last year, tracking active users against a quarterly target, or measuring production output against a historical benchmark.
Creating a target‑only KPI card
- Prepare DAX measures (e.g.,
Total Sales This Year,Total Sales Last Year).
Total Sales This Year = SUM(Sales[Amount])
Total Sales Last Year = CALCULATE(SUM(Sales[Amount]), SAMEPERIODLASTYEAR('Date'[Date]))
- Add the KPI visual from the Visualizations pane.
- Assign data: Drag the indicator to Indicator value, the comparison to Target value, and leave Trend axis empty.
- Remove the trend line via formatting (set Trend axis to “Off” or adjust transparency).
If Power BI insists on a trend axis, switch to a Card visual. Best practices recommend hiding trend lines for clarity, using conditional formatting, and ensuring the target remains a clear, static reference.
My Take
As a data‑visualization specialist, I find the KPI card’s simplicity a boon for executive dashboards. By stripping away unnecessary trend lines, stakeholders can instantly gauge performance against realistic benchmarks. The flexibility to swap in DAX measures lets teams tailor metrics without extra clutter. Just remember to keep targets meaningful and avoid over‑loading the visual with legend or tooltip noise—clean design equals faster insight.
Pay‑The‑Price: Mastering Technical Debt Before It Hits Your Bottom Line
In a sprint‑driven world, shortcuts are the norm. They get features out fast but accumulate what we call technical debt—spaghetti code, slow delivery, and systems that nobody dares to touch. As Dmitry Nazarevich, CTO at Innowise, notes, “Technical debt isn’t just a code problem; it’s a structural issue that reflects decisions made under pressure. The longer it’s left unaddressed, the more it limits scalability, performance, and delivery speed.”
The article walks through how to spot debt early, flag red‑flags, and embed debt management into the delivery process. It stresses that debt is often intentional, a short‑term trade‑off, but ignoring it inflates costs just like an unpaid loan. To avoid a crisis, teams should:
- Treat debt as part of the sprint, not a post‑mortem item.
- Translate technical metrics into business language for executives.
- Foster a culture where developers flag problems without fear.
Ultimately, planning for debt means tracking, prioritizing, and carving out time (and sometimes external help) to keep the system healthy. The takeaway? Technical debt is a business risk that demands proactive, continuous attention.

My Take
The author succinctly reminds us that technical debt is not a mere coding nuisance—it’s a structural liability that can choke growth. By embedding debt tracking into regular workflows and speaking in ROI terms, teams can prevent hidden costs from snowballing. A disciplined, transparent approach protects both product integrity and future scalability.
Learning Loop
Antonio Gulli’s 400-page draft of “Agentic Design Patterns” is a valuable resource for developers, covering AI agent building and scaling. The book, supporting Save the Children, includes prompting strategies, multi-agent collaboration, and safety frameworks.
Designing Data-Intensive Applications helps software engineers and architects navigate the diverse landscape of data processing and storage technologies. It examines the pros and cons of various tools, helping readers make informed decisions and effectively utilize data in modern applications.

Final Thoughts
This issue of DevGyan Download highlights a pivotal moment in the tech industry. It’s clear we’re moving beyond a singular focus on rapid innovation and into a more mature, thoughtful phase. The days of simply building the fastest solution are over. Now, success is defined by a blend of agility, strategic foresight, and sustainable practices.
From choosing an open-source database to managing technical debt, every decision in 2025 has a ripple effect. The lessons here are interconnected: FerretDB Cloud shows how a smart, open-source strategy prevents future vendor lock-in. KPI cards prove that simplicity in design leads to quicker, better business decisions. And the critical conversation around technical debt reminds us that long-term health and stability must be a core business priority, not an afterthought.
As data professionals, our role is no longer just about building. It’s about leading with an understanding of these long-term impacts. By making conscious choices today, we can ensure our systems and our careers are positioned for success in a landscape that values not just speed, but also resilience and purpose.